we’re diving into a realm that’s both practical and packed with geeky charm—Fragmentation Analysis. If you’ve ever scratched your head over how to extract useful size info from a chaotic image of blasted rubble, or if you’re just curious about automation tools, this post is your ticket to enlightenment. We’ll be centering on my very own fragmentation analysis software (check it out at fragmentation.blast-drafter.com) to walk you through the fascinating world of image processing, breaking down the tech logic in a way that’s easy to digest. Ready to geek out? Let’s roll!
Why Does Fragmentation Analysis Matter? Well, Sort Of...
 In fields like mining, construction, and blasting engineering, fragmentation analysis has its place, but let’s be real—I don’t think getting hung up on exact particle sizes is the point. Honestly, the real value isn’t in pinpointing whether a rock is 2.54 cm or 2.55 cm. What we actually need is a rough distribution of sizes to make quick comparisons. Think of it as checking if this blast produced more uniform chunks than the last one, or if a new process reduced the number of pesky oversized boulders. Manually tracing outlines and measuring each piece? That’s a soul-crushing waste of time, like debugging code without a console. We need a fast, automated way to get a “good enough” picture of block size distribution for side-by-side comparisons, not a lab-grade precision report. That’s the philosophy behind my tool at fragmentation.blast-drafter.com—freeing engineers from tedious grunt work so they can focus on decisions, not data entry.
Step 1: Loading and Prepping the Image
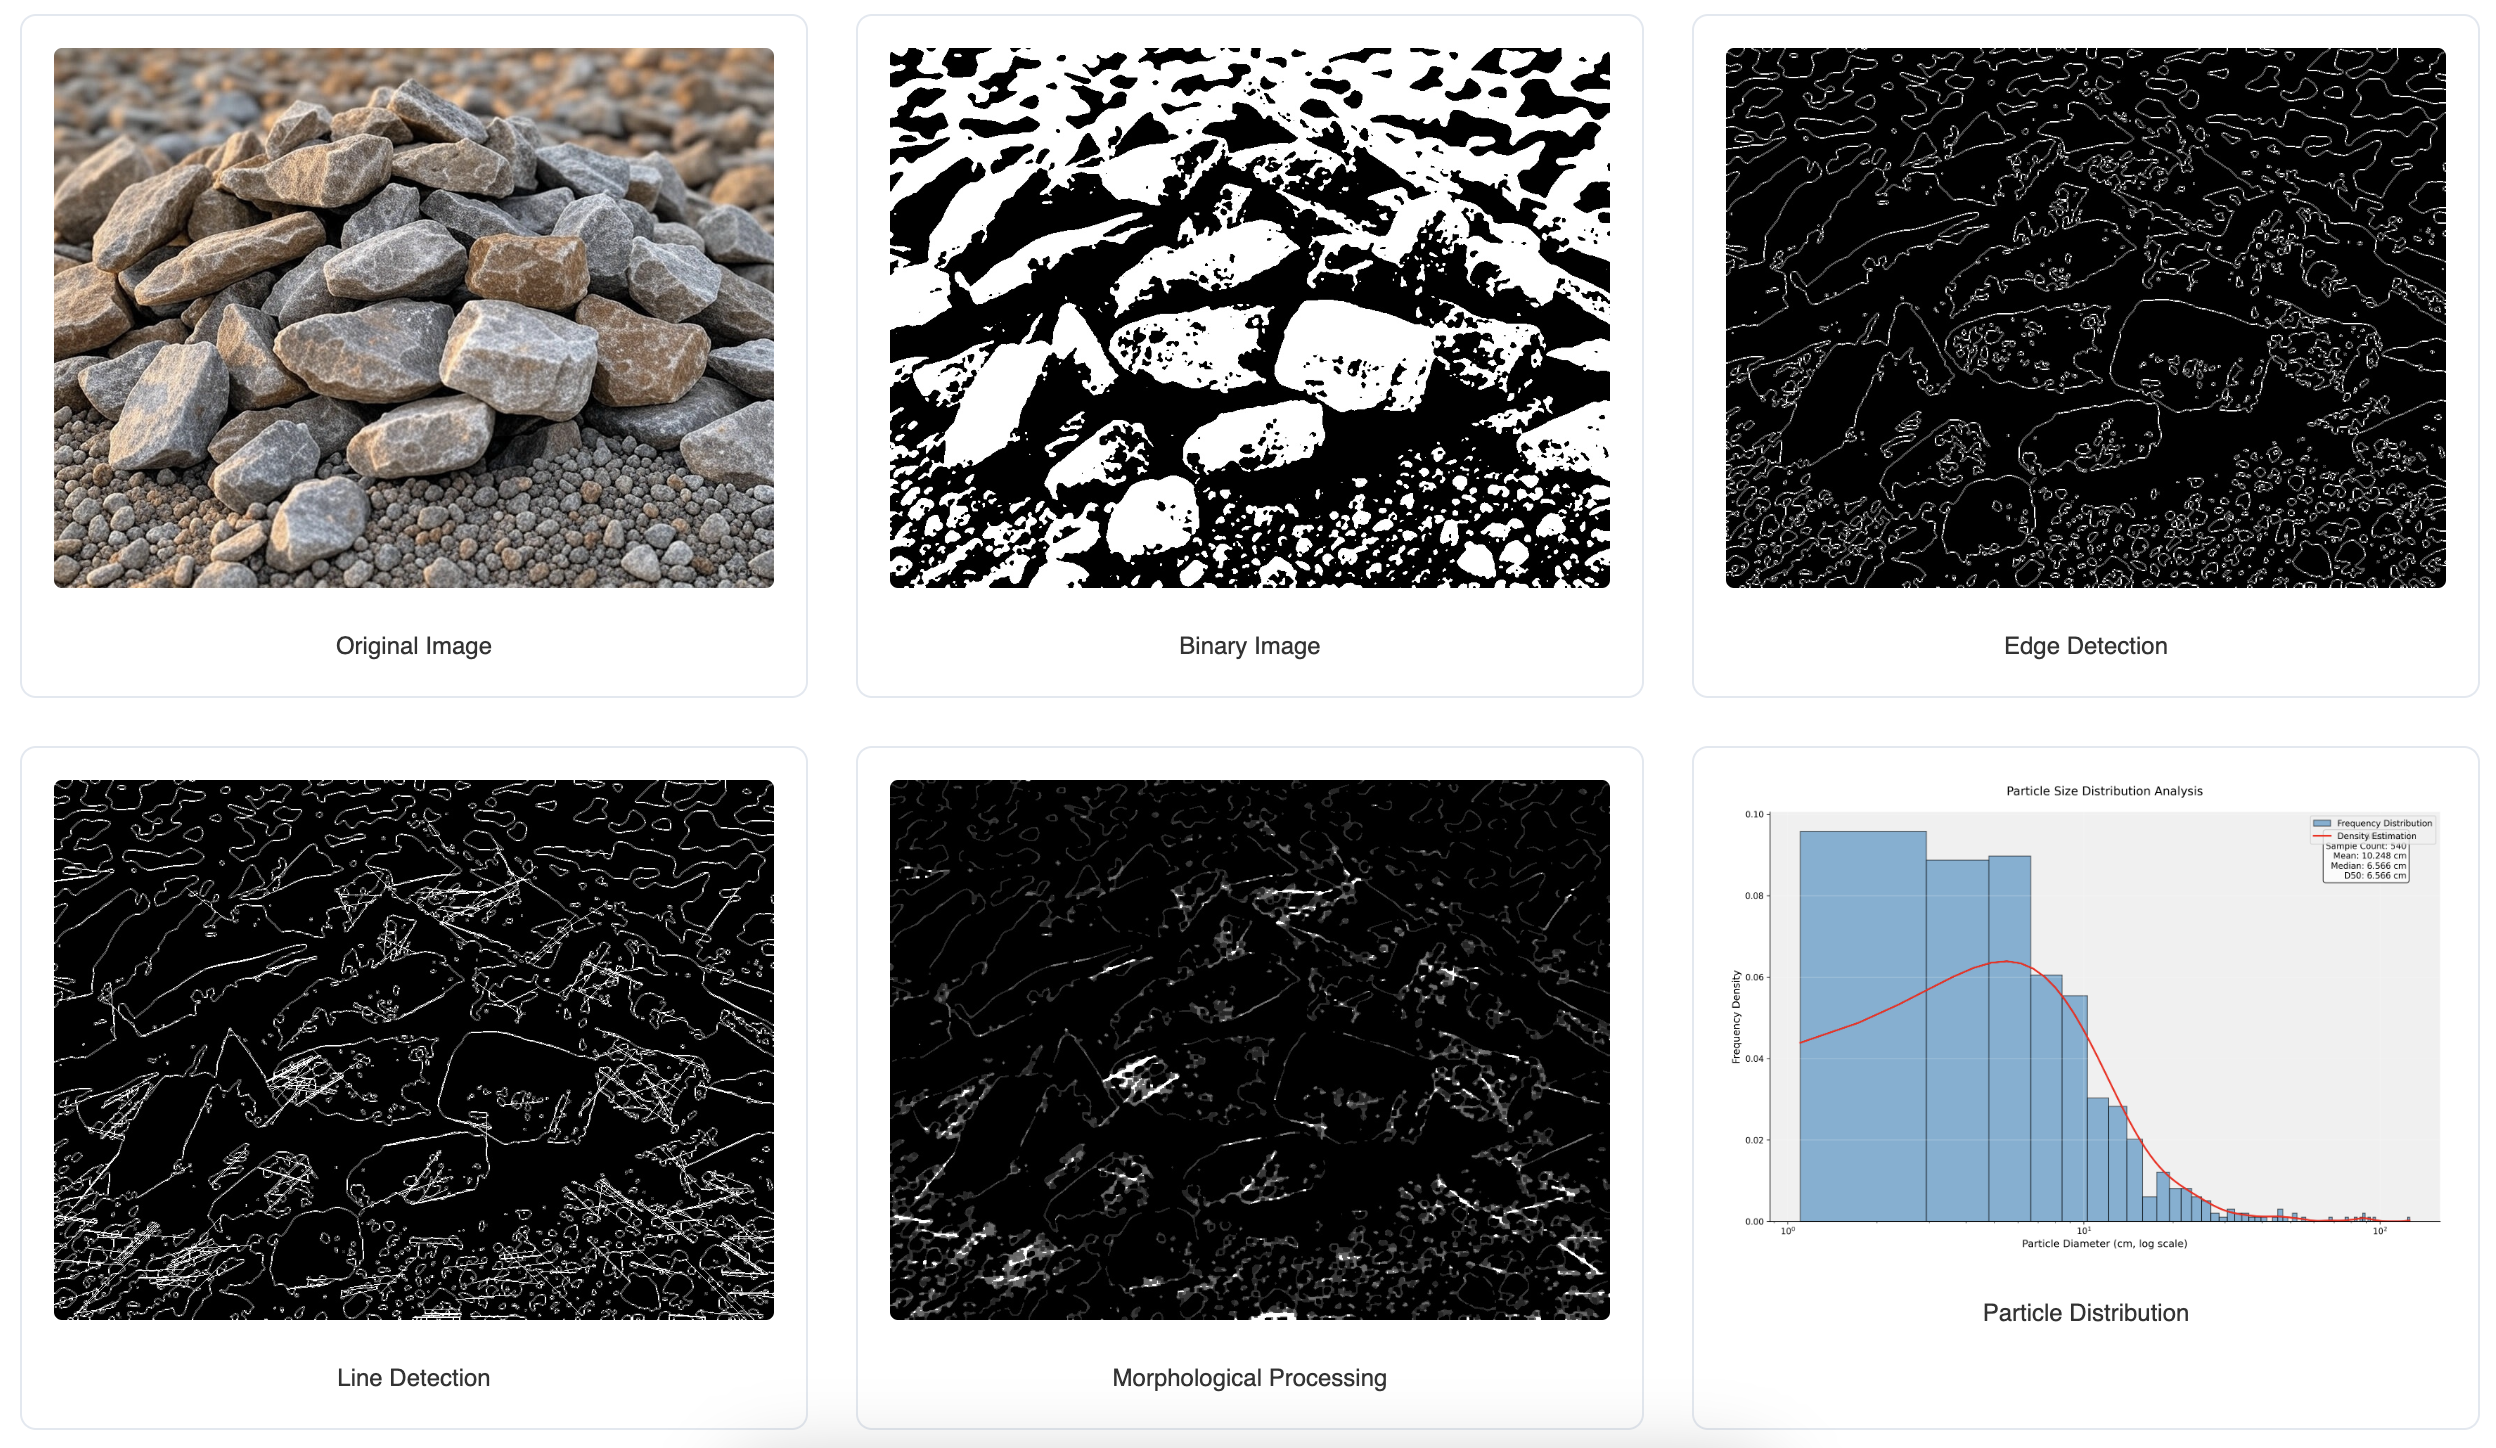
It all starts with loading the image. Whether it’s a snapshot of blasted gravel from a site or a lab photo of powdered samples, we first pull the image into the system and convert it to grayscale. Why grayscale? Because color data is just extra baggage in size distribution analysis. Grayscale lets us zero in on shapes and boundaries without distractions.
On the tech side, we use OpenCV’s cv2.imread() to load the image and cv2.cvtColor() to make the switch. It’s a small but crucial step, setting a solid foundation for what’s next. Plus, the software keeps copies of both the original and grayscale images, so you can always backtrack—because analyzing without backups is like coding without version control. Disaster waiting to happen.
Step 2: Filtering Noise, Cleaning the “Static”
Real-world images are messy. Uneven lighting, dust on the lens—you name it, it’s there to mess with your analysis. These imperfections can throw off edge detection and contour mapping, so we’ve gotta clean house. The software uses median and Gaussian filtering to smooth out the image and cut down on irrelevant details.
Think of this as “pre-washing” your data to ensure the next steps aren’t working with garbage input. Post-filtering, the image looks sharper, paving the way for binary conversion and edge detection.
Step 3: Binarization, Simplifying the Chaos
In image processing, binarization is where the magic starts. By setting a threshold, we turn the grayscale image into a stark black-and-white map—pixels are either black or white, no in-between. This makes particle boundaries stand out, setting the stage for contour detection.
At fragmentation.blast-drafter.com, we leverage OpenCV’s cv2.threshold() for this. It’s like drawing a clear line in a messy problem, simplifying everything for the analysis ahead.
Step 4: Edge Detection, Sketching Particle Boundaries
Next up, we use the Sobel filter for edge detection to spot the boundaries of particles or fragments in the image. This is the backbone of the analysis since we need those edges to estimate block size distribution.
The software calculates gradient changes in the x and y directions, combining them into an edge intensity map. It’s not perfect, but it’s like spotting a faint trail in overgrown weeds—good enough to work with for our purposes.
Step 5: Morphological Processing, Polishing the Output
After edge detection, there might still be tiny gaps or noise in the image. We tackle this with morphological operations (like closing), refining the image by filling small holes and connecting broken edges. It’s the equivalent of exception handling in code—tidying up to make sure the final output is usable.
Step 6: Block Size Analysis, Capturing the Big Picture
Now for the fun part—block size analysis. Using cv2.findContours(), the software identifies particle outlines in the image, calculates the area of each block, and converts it to an equivalent diameter. Let’s be clear: we’re not chasing pinpoint accuracy here. A scaling factor turns pixel measurements into rough physical units (like centimeters), which is plenty for comparison purposes.
The results include stats like total block count, min/max diameters, average and median diameters, and key percentiles like D10, D50, and D90. These figures aren’t about precision—they’re about spotting trends across different batches or processes. At fragmentation.blast-drafter.com, everything gets saved as a text file for easy access.
Step 7: Visualizing Distribution, Making Trends Obvious
Got the data? Cool, but raw numbers don’t tell a story. Visualization does. The software uses matplotlib to whip up histograms and cumulative distribution curves for block sizes, letting you see at a glance how the material is distributed. Is it uniform? Are there multiple peaks? These charts make comparisons a breeze.
On top of that, data is exported as a CSV file for deeper trend analysis or integration with other tools. A good tool doesn’t just spit out results—it gives you control over them.
Wrapping Up: From Images to Insights, Tech Powers Decisions
With these steps, we’ve gone from raw images to a full block size distribution analysis. Let me hammer this home: fragmentation analysis isn’t about exact measurements. It’s about snagging quick distribution trends for side-by-side comparisons and smarter decision-making. Whether you’re evaluating blast outcomes or comparing material consistency, fragmentation.blast-drafter.com saves you hours, letting you focus on engineering, not eyeballing rocks.
If fragmentation analysis piques your interest or you’ve got a project needing fast distribution comparisons, swing by the site and give it a spin. Drop your thoughts or use cases in the comments too! I’m always tinkering with the software, aiming to add smarter features to better serve engineering needs. Let’s chat, share ideas, and level up together!
comments (0)
please login to comment